How to Split a Series into Multiple Series
Description
A Data Series can be split into multiple logical series using a sub-series. This technique is useful in situations where the data you would like to plot can easily be split into multiple series - such as sales information over multiple years by company.
Discussion
Normally, multiple data series would be plotted as three separate data series. However, if the data you would like to plot is contained in one data series, the data series can be split on a sub-series to create multiple series. Suppose we have the following Data Series and would like to plot the Sales sub-series in a Bar chart.
Sales|Year|Company
1200|2001|Toyota
1500|2002|Toyota
1600|2003|Toyota
1400|2001|GM
1600|2002|GM
1650|2003|GM
400|2001|Ford
1800|2002|Ford
2650|2003|Ford
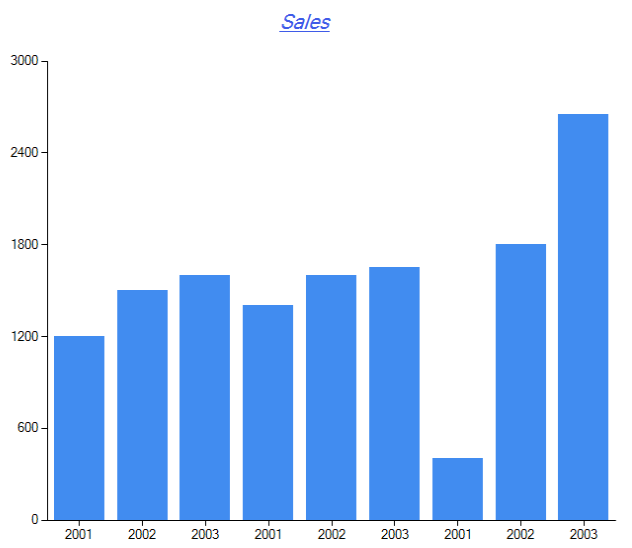
Without splitting the data, there is no way to differentiate between the Sales for each Company for each year:
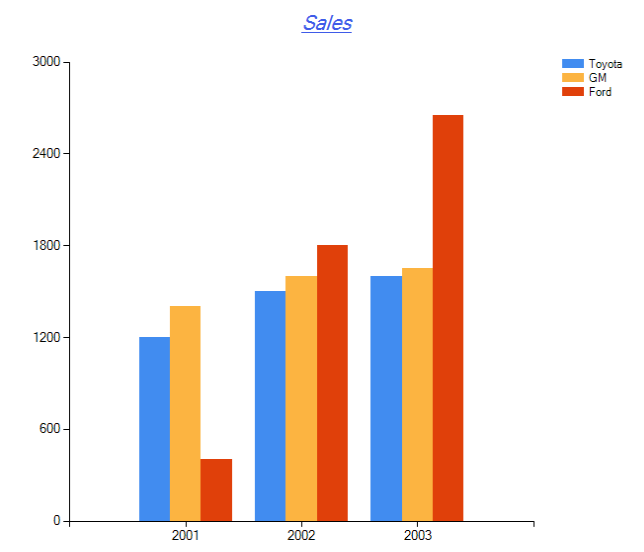
By splitting the Data Series based on the Company sub-series, the Chart control will treat the Sales information as if it were three separate Data Series, making it easy to compare how each Company performed each year:
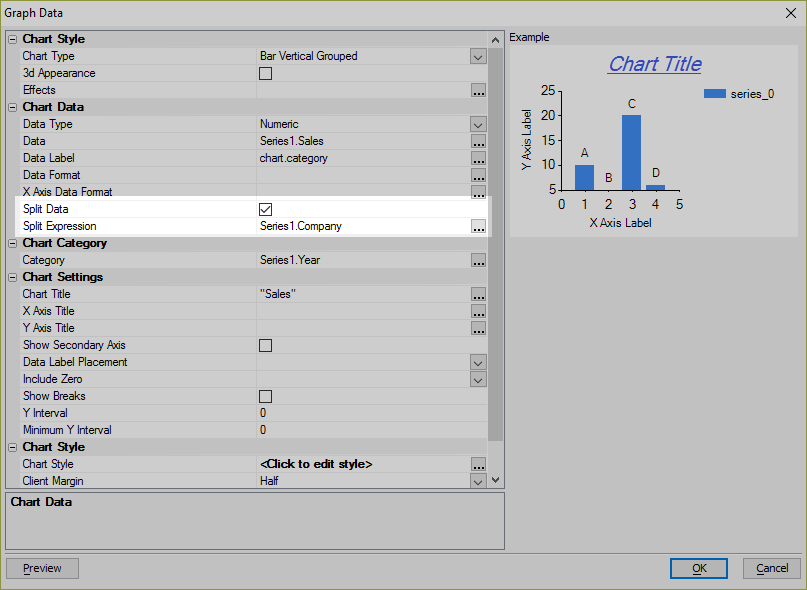
This was accomplished by enabling the Split Data property in the Chart control's settings and selecting the Company sub-series for the Split Expression
Watch the video below for detailed instructions on how to split a Data Series into multiple series.
Splitting a Single Physical Series into Multiple Logical Series to Plot a Dynamic Number of Series on a Chart
This video shows you you can plot a dynamic number of series on a chart by splitting a single physical series into multiple logical data series.
See Also